
BAGLEY VALUE RATING
A plethora of metrics exist to evaluate NFL quarterbacks. However, as modern-day QB salaries grow historically larger, a new metric is needed to determine if a player is actually worth the contract he signs. The Bagley Value Rating is a new metric that considers both a quarterback's stats and salary to determine if the player is "valuable" or not. In other words, if the player is over or under performing based on their contract and league averages.
By Ben Bagley
INTRODUCTION
In the discourse of today’s sports media outlets that cover the National Football League, there are a number of different metrics used to evaluate a quarterback’s skill. Many people use basic statistics such as passing yards, touchdowns, interceptions and completion percentage to judge QB’s, but the conversation has largely shifted more towards advanced metrics. New metrics have been invented to attempt to provide a deeper evaluation of how good a quarterback is by using basic stats coupled with advanced algorithms and technologies. These metrics, which include Passer Rating, QBR, Adjusted Passer Rating and QB Score, have enabled the media to more passionately debate which quarterbacks are better than others. However, I noticed one thing that seemingly every metric on the market was missing: they all are able to quantify on-field performances, but there is no regard to the financial side of professional football.
The NFL is a league with a hard salary cap. The cap, which marginally increases or decreases every year based on league revenue, is how much money every team has to pay the salaries of their players. In 2020, the NFL salary cap was $198.2 million. Under the umbrella of the cap, teams have the freedom pay players any salary under the cap value. However, an NFL roster consists of 53 players, so teams must be calculated in dividing up the funds in order to have the most complete, well-rounded roster possible. Players of a higher skill level (which can be determined by advanced metrics) typically demand higher salaries, so teams are in a tricky position when deciding how much to offer a player. If a team pays a player too much, then they won’t have enough money to round out other positions. If a team offers a player too little, the player is unlikely to sign with the team and will go to a different team.
Quarterbacks are widely considered the most influential position to the success of an NFL team. As historical trends have shown, teams with good quarterbacks enjoy success, and teams with bad quarterbacks suffer failures. Therefore, since quarterbacks are the most important, they are the highest paid position. Teams want the best QB possible, but the better the player, the more money the team must pay them. By coupling this idea with the previous, the obvious conundrum materializes: teams desire the best quarterback possible, but also want to avoid paying too much in order to have enough salary cap room left to fill out the best overall roster possible.
Herein lies the question, “which quarterback will give me the most production on the lowest salary?” This is the idea of value in this project. The most financially valuable quarterbacks are ones who can put up statistics that far exceed their salary. The least financially valuable are players whose statistics are far worse than their salary. So, which quarterbacks are the most valuable? The best quarterbacks are the ones paid the most, but do they give teams the most bang for their buck? Which quarterbacks are the least valuable and most overpaid, anecdotally ripping their teams off most? By identifying the most and least valuable players, we can add a deeper level of evaluation to NFL discourse. This is where the Bagley Value Rating (BVR, pronounced “beaver”) Score comes into play. This metric takes a quarterback’s stats and salary and, based on other quarterback’s stats and salaries, manufactures a “score”, which arbitrarily evaluates that player’s financial value. While other advanced metrics work to figure out which QB is best overall, the BVR Score adds a new dimension by figuring out which quarterback is the most valuable, giving the team the most (and least) bang for their buck.

Dallas Cowboys' quarterback Dak Prescott is the highest paid QB in 2020, with a salary of $31.4 million. Sports media outlets have debated how good he is, but the Bagley Value Rating Score looks at the question: "is he worth his contract?" Instead of opinions, this metric provides a mathematical answer to whether or not he is overpaid or underpaid, and if his level of play warrants a massive contract.
INQUIRY QUESTION
In creating this project, we are investigating the question, "To what extent can the new BVR metric improve the way that sports media outlets evaluate NFL quarterbacks?" With this metric, we are adding an entirely new dimension to quarterback discourse. Instead of adding yet another metric that can be used to debate which player is better than another, we can now debate which player is more financially valuable than another. In launching this project, we want to explore the metric and all it contains, but also to investigate what this metric can tell us about certain players, free agency, contract extensions, and the financial aspect to the quarterback position as a whole. We are not attempting to quantify which player is better than another, but rather discover how a metric that asks a different question can improve our NFL discourse.


LITERATURE REVIEW
The idea of “quarterback value” has taken on many meanings in the past fifty years. The most common of these ideas is the passer rating metric. Passer rating was formally adopted by the NFL as the official metric for rating quarterbacks in 1973. Created by Don Smith, Seymour Siwoff and Don Weiss, this metric rates passers against fixed statistical performances which are based on all statistical achievements of qualified passers since 1960. A key term is “passers” instead of “quarterbacks,” because occasionally other players in other positions throw a pass. This system uses four categories as a basis for compiling a rating. These variables are: percentage of completions per attempt, average yards gained per attempt, percentage of touchdown passes per attempt, and percentage of interceptions per attempt. Calculations on these variables follow simple mathematics (Zilavy, 2019), but its existence has sparked many statisticians to attempt to perfect the concept.
Derek Stimel (2009) concluded that it was inappropriate to compare quarterbacks from different eras, and that modern-day quarterbacks’ ratings were much higher due to a more pass-centric offensive state. He dove into the relationship of the four variables used to see if the original passer rating model possessed flaws. In the research, the team tested for structural breaks in the means and standard deviations of each variable. The analysis found evidence that structural breaks existed, which means that evidence was found that NFL offenses have changed over the years since 1960. David Berri (2010) followed this criticism and created “QB Score”, which was built counteract the fact that if a quarterback simply throws more, he will always have a higher passer rating. However, Berri’s model fails when accounting for quarterbacks who are exceptional at running the ball (Sielski, 2011), and still suffers from the issues that Stimel pointed out.
Paul von Dohlen (2011) introduced a different tweak to the rating. He agreed with Stimel’s point, and thus – in simple terms - replaced completion percentage with yards per attempt. Ahmad Cheema (2019) took this a step further and created the Adjusted Passer Rating. The main difference is that APR uses net yards per pass attempt instead of passing yards divided by passing attempts. NY/A factors in the quarterback being sacked: (passing yards – sack yards) / (passing attempts + sacks). Completion percentage was also removed from this model in order to not reward quarterbacks for passes that are completed for zero or negative yards. But, as L.A. Albert claims in a Master’s thesis for the Univeristy of Wisconsin (Albert, 2019), these metrics fail when considering the unpredictability of football. A quarterback’s score in any of this metric is heavily impacted by his offensive line, and successes/failures of his pass catchers. Therefore, more is needed to tell the complete story.
To build on this, Joyner (2005) argued that quarterback rating should be broken down into depth zones of short, medium and deep. Then, by analyzing tracking data from receivers, defensive backs, and pass protection, he created his own analysis of passing games. This method involves player tracking data, which is becoming more and more prevalent in the NFL’s analytical advancement. This led to the most major modern advancement in the rating dilemma: ESPN’s QBR – Total Quarterback Rating (Nwulu, 2011). This rating system considers all kinds of situational factors in order to more comprehensively explain the relative success of a quarterback. All QBR baseline statistics are from historical NFL data (Oliver, 2011). This metric uses complex and advanced data including expected points and a clutch index, and it is considered the ideal baseline for examining a “quantitative way of explaining winning or losing quarterback play,” (Nwulu, 2011).
All of these metrics focus attempting to quantify a quarterback’s skill. However, the BVR Score considers salaries, and therefore we must understand how a salary cap has impacted the NFL. The “superstar” philosophy is having an elite player at a position and paying them an exuberant amount of money, under the hope that the player’s talent will carry the rest of the team. Borghesi (2008) disputes the success of this philosophy. In a study, he analyzed salary and success data from the NFL to attempt to find a correlation between salary amount and team success. Ultimately, he concluded that the superstar philosophy on offense actually worsens a team’s success. Because of this, Borghesi wrote that “teams that compensate players the most inequitably are those most likely to perform the worst.” For the BVR Score, we will be able to launch into this question as well, to see if the highest paid players are actually as valuable as average-paid players.
In separate papers, Lewis (2003) and Haugen (2006) also praise the philosophy of egalitarian spending over the superstar philosophy. Lewis proposes the idea that it is not about how much a team spends on an elite player, but rather how well efficiently they spend money on the entire roster. For a team to find success, Lewis argues, they need to fill out every role evenly, not overpay one and underpay another. Haugen incorporates this philosophy into his own research, wherein he studied whether or not certain positions significantly contribute to team success. In his findings, he discovered that quarterbacks do not significantly contribute to team success. That is not to say that having an elite QB doesn’t help a team win, but rather a team can win with an average/good QB as long as they fill out the rest of the roster efficiently.
Max Winsberg (2015) also launched a research project in the same mindset, but specifically focused on offensive linemen and quarterbacks. By using Gini coefficients and NFL data, he concluded that spending more than league average on a quarterback was actually negatively correlated to team success. This means that teams who follow the superstar philosophy actually suffer from overpaying their quarterbacks.
Through evaluation of these projects, we can understand two truths of the BVR Score. The first is that this metric follows the research that has been done to improve passer rating, and the statistics used in the metric more closely follow peer-reviewed “effective” stats. Secondly, we know that paying an elite quarterback a large amount of money actually has the potential to hurt a team – if that quarterback doesn’t perform to his salary. The BVR Score will tell us if a QB is performing above or below his salary level, and therefore if he is valuable to the team and their success, or not.
Major media outlets like NFL.com have discussed the idea of value but without a quantitative statistic to back them up. Gregg Rosenthal of NFL.com writes in an article titled “NFL QB value rankings: Who do you want most at current cost?”, “considering talent, production, age and contract, which QB would you most want to have under your team's control moving forward?” (Rosenthal, 2020). This question is extremely common and wildly crucial to the continued success of an NFL team, but the only discourse on this topic is opinion based. Therefore, in order to have the same level of discourse about quarterback value as we do quarterback skill (with QBR, Passer Rating, and other mentioned metrics), the Bagley Value Rating becomes a necessary tool. The Bagley Value Rating considers the variables used in Passer Rating and Adjusted Passer Rating (along with more variables to account for a passer’s rushing statistics), and then evaluates the result based on the salary of that player.
In doing this, a new avenue of NFL discourse can be unlocked. This metric can spark a new discussion – not about which player is better, but rather which player is providing teams with the most bang for their buck. Young quarterbacks will have extremely high values in their years with a smaller contract, but veterans playing at an elite level can still provide value with a large contract. This way of thinking approaches the NFL and salary cap puzzle and begins to provide answers of who is overpaid, who is underpaid, and how much a certain player is worth based on how they are performing compared to league average stats and contracts.

METHODOLOGY
The BVR Score uses both in-game statistics and yearly salary to determine the results. It is important to know that this metric is not static, as salaries change year to year. For this initial project, I ran the algorithm on the statistics and salaries of every starting QB’s game through Week 10 of the 2020 NFL season. If a player started all ten games, he will have ten data points in a scatterplot, with the x-axis representing the Raw BVR Score, and the y-axis representing salary. From there, I ran a linear regression to find what the expected Raw BVR Score for each salary was, based on the numbers from the entire league. A player’s final BVR Score is the mean of their standardized residuals, which is then multiplied by ten for readability. The entire methodology is provided below.
The BVR Score uses both in-game statistics and yearly salary to determine the results. It is important to know that this metric is not static, as salaries change year to year. For this initial project, I ran the algorithm on the statistics and salaries of every starting QB’s game through Week 10 of the 2020 NFL season. If a player started all ten games, he will have ten data points in a scatterplot, with the x-axis representing the Raw BVR Score, and the y-axis representing salary. From there, I ran a linear regression to find what the expected Raw BVR Score for each salary was, based on the numbers from the entire league. A player’s final BVR Score is the mean of their standardized residuals, which is then multiplied by ten for readability. The entire methodology is provided below.
Variables
For this project, I am using seven variables
Net Yards Per Attempt (NY/A).
(passing yards – sack yards) / (passing attempts + sacks).
This will allow us to take into account a more complete version of completion percentage, as seen in the APR (Adjusted Passer Rating – Cheema, 2019).
Interception Rate
(interceptions) / (passing attempts)
This variable will allow us to measure interceptions thrown as a negative value, while also being able to measure the percentage of throws that are interceptions, in order to account for quarterbacks who throw the ball more than others. This is used in Passer Rating
TD Rate
(touchdowns) / (passing attempts)
Same idea as interception rate.
Yards per Completion
(total passing yards) / (pass completions).
Following APR’s philosophy of having a more complete idea of completion percentage, this variable benefits quarterbacks who throw the ball for more yards on average, rather than completions for zero or negative yards.
Yards per Rush
(total rushing yards) / (rushing attempts).
In order to attempt to work around Berri’s QB Score’s pitfall with under evaluating rushing quarterbacks, this variable is added to boost the value of quarterbacks who often run. In 2019, the NFL MVP was Baltimore Ravens quarterback Lamar Jackson, and he set the single season rushing record for a quarterback with 1,206. For reference, the 2019 NFL rushing leader was Tennessee Titan’s running back Derrick Henry with 1,540. Running quarterbacks are having more of an impact on today’s NFL landscape, and incorporating these stats in total quarterback value is essential.
Rushes from kneeling the ball are excluded in this metric. It is common for quarterbacks to simply take a knee on a play when their team is ahead at the end of a game, since it keeps the game clock running and allows the leading team to drain the last bit of time from the clock and win. These rushes should not hurt a quarterback’s rushing stats, since they aren’t “real” rushes.
Touchdowns per Rush
(total rushing touchdowns) / (rushing attempts)
In incorporating rushing statistics into a quarterback’s value, rushing touchdowns are just as valuable as passing ones. This must be reflected in any value conversation.
Salary
The salary used in this equation is their cap hit for the current year. It does not consider their total contract, but only how much they are making that year. For example, Chief’s quarterback Patrick Mahomes just signed a 10-year, $450 million contract, but he is only making $5,346,538 in 2020 due to it being the final year of his rookie contract.
Calculations
The overall calculation for a BVR score is currently incomplete due to more data being needed. It will soon have enough data points, as this is currently being written in the middle of the 2020 NFL season, but until then we will stick to the ideology rather than the calculations.
Raw Score
To calculate a player’s raw score, the following calculation is used, based on the above numbered variables:
[(Var1)*10 – (Var2)*1000 – (Var3)*1000 – (Var4)*2 – (Var5)*2 – (Var6)*1000] / (Var7)/100,000
2. Raw Score in English
The idea of multiplying variables by different amounts is to get them all into numbers of similar value, so that each variable is weighed as desired. To calculate a player’s raw score…
Net Yards per Attempt is multiplied by 10. An average value for a real QB’s NY/A is around 5.00 to 10.00, and we want this value to have more weight. Multiplying this by 10 will give values of about 50.00 to 100.00, and this is a good number for our calculations.
INT rate is multiplied by 1000. Actual INT rates are extremely low, usually around 2.5 percent. As a number, this is 0.025. This will have almost no value because it is so low, so we multiply by 1,000 to get this number to something more reasonable, like 25.
TD rate is multiplied by 1000 for the same reason. We want our INT rate variable’s numerical value to be higher to hurt a QB for throwing a lot of interceptions, and we want the TD rate to be higher to benefit a QB for throwing touchdowns.
Yards per completion is multiplied by 2 to give it a little bit more say in the formula. An average YPC is around 10, so we will multiply that value by 2 to make it a closer value to the other variables.
Yards per rush is multiplied by 2 for the same reason as part iv.
TD’s per rush is multiplied by 1000 for the same reason as TD rate in part iii.
All of the above variables are added together. Var2, INT Rate, is treated as a negative value so it hurts the overall score. Every other variable is positive, and boosts the score. Once these variables are summed, they are divided by…
Desired Year Salary / 100,000. In order to get salary on the same numerical “level” as all of the other variables, we will divide it by 100,000. NFL salaries are phenomenally high, and dividing our variables by a salary as high as $31 million would give a microscopic number. Instead, we will divide the salary and (for our $31 mil example) end up having a more manageable value of 310.
Graphs and Regressions
By using this formula, for each starting quarterback’s game for each week, we will be able to create a scatterplot of Raw BVR Scores (RBS) compared to salary.
Scatterplot
A scatter plot is a type of plot or mathematical diagram using Cartesian coordinates to display values for typically two variables for a set of data.
Our x-values (horizontal variables) will be salaries. Our y-values will be RBSs. This will create a scatterplot that will show the relationship of salary compared to RBS for all of every starting quarterback’s games.
Linear Regression
From our scatterplot, we will run a linear regression to both a) check for linearity of the graph and b) create a “league average” BVR score based on salary.
By running a linear regression, we are able to create a line of best fit through our data, and each point will have a residual. A residual is how far above or below the line of best fit (a.k.a expected values) a point is. A positive residual means the actual value is greater than the expected value, and a negative residual is the opposite.
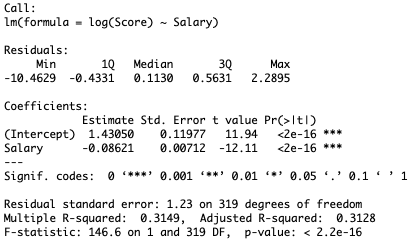
Initially, the scatterplot showed that the data followed a very strong negative exponential curve. In order to attempt to linearize the data, I transformed the y-values (RBS) with a logarithmic function. On the final regression, the RBSs used were actually the value from log(RBS).
Finding True BVR Scores
Standardized Residuals
Standard Deviation
Standard Deviation is the square root value of the Variance. Variance is a measurement of the spread between numbers in a data set. Standard deviation measures the dispersion of a dataset relative to its mean. The larger the standard deviation, the farther from the mean the dataset lies.
To find the true BVR Score for a player, found the mean (average) of their standardized residuals. While residuals are how far above or below a point falls from its expected value, standardized residuals normalize the data and instead quantifies how large the residuals are in standard deviation units. A very large, positive standardized residual means that the data lies well above the expected value, and large but negative means the data lies well below. A value of 0 means that the actual value lies right on the mean. In our context, that would mean that a player is performing at exactly his salary level. Positive values mean over performing, and negative values mean underperforming.
Because we are using standardized residuals and have a very large dataset, we can use Z-scores to roughly estimate how the player compares to other players at his salary level. For example, if we take the inverse Z value of a player’s BVR score, we are able to say what percentile that player’s score falls in compared to other theoretical players of the same salary.
FINDINGS AND RESULTS

The first gallery that I have provided are all of the plots, graphs and summaries of the math behind the linear regression. In short, we found that the data from the quarterbacks followed a negative exponential curve. In order to correct this, our final BVR score was the regression based on salary and the logged value of the Raw BVR scores. This doesn't change our results, but is important to identify. In these scatterplots, each point is one game from one player.
In the gallery below, please click on the scatterplot to view all of the plots and graphs from this project.


BVR SCORE RESULTS
This is our final table of all of the BVR Scores for every NFL team's primary starting quarterback. Every player who has a positive BVR Score is considered to be outperforming their contract, and are considered valuable. All of the the players with a negative score are considered to be underperforming their contract, and are not considered valuable. A player with a score very close to zero is considered to be performing as expected based on their contract. Due to the mathematics behind calculating the scores, we can make the claim that if a player's score is above or below +/- 10, then they are significantly valuable or significantly not valuable.
From this table, we can see that the most financially valuable quarterback in the NFL is the Jacksonville Jaguar's Gardner Minshew. The least financially valuable QB is the New York Jets' Sam Darnold. Minshew and Darnold can each be considered significantly valuable/invaluable, respectivly, and the Chicago Bears' Nick Foles is also significnalty invaluable.


BVR SCORES BY SALARY
This is the same table, but organized by Salary instead of score. In looking at the table this way, we can see a very clear view of which highly-paid quarterbacks are worth the money, and which ones are not.
As the highest paid quarterback in the NFL, Dak Prescott has a BVR Score of 5.189, meaning that he is performing in nearly the 70th percentile of all theoretical quarterbacks with his same salary. This is a terrific number. He is being paid a very large amount of money, but his stats are so much better than league average that he is worth the money.
With a salary of $26.6 million and a BVR score of -4.846 and a percentile value of 31.397, Jimmy Garoppolo appears to be the highest-paid quarterback who is not valuable and not worth his contract.
CONCLUSION
Our inquiry question was, "to what extent can the new BVR metric improve the way that sports media outlets evaluate NFL quarterbacks," and we can clearly see how the discourse can be changed.
Take, for example, Dak Prescott. With the Dallas Cowboys, 2020 is the final year that he is under contract. There have been debates in sports media for well over a year, trying to figure out if Dak is worth the money or not. People have used metrics and opinions to try and figure it out, but his BVR Score provides the actual answer: yes!
Now consider somebody like Sam Darnold. He is nearing the end of his rookie deal, after being selected #3 overall in the 2018 NFL Draft. At this point in his career, with a BVR Score of -11.24 he is significantly underperforming his roughly $8.3 million contract. Therefore, in our evaluation of Sam Darnold as an NFL QB, the media can claim that because he is underperforming his rookie salary, that he is not worth a major NFL contract. Different debates can be had on whether or not he is a good player, but this metric tells us that he is currently not worth what he is being paid, at all.
Also consider a player like the Las Vegas Raiders' Derek Carr. He recently signed a new deal, and he is being paid $21.5 million in 2020. His BVR Score is 0.2385, and he is performing in the 51st percentile. So, whether or not your opinion of Derek Carr leads you to believe that he is either good or bad, the numbers tell us that he is performing right exactly as he should be for how much he is being paid. The Raiders are not getting a great deal with him as QB, but they are not being ripped off either – they are getting exactly what they paid for.
With the addition of the BVR Score, we can evaluate quarterbacks in a way that we never have before. Now, instead of arbitrary opinions on a players skill level driving the discussion about his value to a team, we can have a more holistic view of their contributions. If a quarterback makes more money, then other positions will make less, and that could cause a team to suffer. For example, if Dak Prescott was making his current salary, had a negative BVR Score and the Cowboys were losing every week because they couldn't afford to sign any other talented offensive players, we would be able to deduce that he is not worth that salary because the team needs to spend money elsewhere to be successful.
This metric can be used in a variety of ways to form a spectrum of opinions, but it has successfully created a new dimension to our discourse around quarterbacks. We will always be able to have debates over who is better, but now we can more holistically evaluate whether or not teams are making good decisions on who to pay at QB to get the highest possible bang for their buck, and hopefully see that translate to wins on the field. This metric can now reopen the discussion on the superstar philosophy against the egalitarian one, and is rooted in peer-reviewed mathematics to ensure that we can ground our discussion about value in bona fide metrics.

BIBLIOGRAPHY
Works Cited
Albert, L. A., & Angelis, J. N. (October 2019). Jump balls, rating falls, and elite status: A sensitivity analysis of three quarterback rating statistics (Unpublished master's thesis). University of Wisconsin, Madison.
Berri. The Final Quarterback Rankings for 2009 | Wages of Wins Journal. https://dberri.wordpress.com/2010/02/07/the-final-quarterback-rankings-for-2009/. Accessed 15 Nov. 2020.
Borghesi, Richard. "Allocation of scarce resources: Insight from the NFL salary cap." Journal of Economics and Business 60.6 (2008): 536-550.
Cheema, Ahmed. “Adjusted Passer Rating: Modernizing the Age-Old Metric.” The Spax, 11 Feb. 2019, https://www.thespax.com/nfl/adjusted-passer-rating-modernizing-the-age-old-metric/.
Haugen '06, John (2006) "Team Success and Personnel Allocation under the National Football League Salary Cap," The Park Place Economist: Vol. 14 Available at: http://digitalcommons.iwu.edu/parkplace/vol14/iss1/14
Leeds, Michael A; Kowalewski, Sandra. “Winner Take All in the NFL: The Effect of the Salary Cap and Free Agency on the Compensation of Skill Position Players.” Journal of Sports Economics, 2001, 2 pp. 244-56.
Lewis, Michael. Moneyball. New York: W. W. Norton & Company, 2003.
Sielski, Mike. "Michael Vick Shows How Quarterback Ratings Short-Change Runners - WSJ." https://www.wsj.com/articles/SB10001424052748704312504575618762643111900. Accessed 15 Nov. 2020.
NFL’s Passer Rating | Pro Football Hall of Fame Official Site. https://www.profootballhof.com/news/nfl-s-passer-rating/. Accessed 15 Nov. 2020.
Nwulu, Mac. “ESPN Introduces The Total Quarterback Rating.” ESPN Press Room U.S., 2 Aug. 2011, https://espnpressroom.com/us/press-releases/2011/08/espn-introduces-the-total-quarterback-rating/.
Oliver, Dean. “Oliver: Guide to the Total Quarterback Rating.” ESPN.Com, 4 Aug. 2011, https://www.espn.com/nfl/story/_/id/6833215/explaining-statistics-total-quarterback-rating.
Rosenthal, Gregg. NFL QB Value Rankings: Who Do You Want Most at Current Cost? https://www.nfl.com/news/nfl-qb-value-rankings-who-do-you-want-most-at-current-cost-0ap3000001108258. Accessed 15 Nov. 2020.
Stimel, Derek. “A Statistical Analysis of NFL Quarterback Rating Variables.” Journal of Quantitative Analysis in Sports, vol. 5, no. 2, May 2009. www.degruyter.com, doi:10.2202/1559-0410.1166.
Miller, Ted “What’s Your Quarterback’s ‘Score’?” ESPN.Com, 25 Feb. 2011, https://www.espn.com/blog/pac12/post/_/id/19493/whats-your-qbs-score.
Winsberg, Max, "Player Compensation and Team Performance: Salary Cap Allocation Strategies across the NFL" (2015). CMC Senior Theses. Paper 1006.
http://scholarship.claremont.edu/cmc_theses/1006
Zilavy, Gary. “How to Calculate NFL Passer Rating Using a Formula in Excel or Google Sheets.” Medium, 26 Dec. 2019, https://medium.com/@gzil/how-to-calculate-nfl-passer-rating-using-a-formula-in-excel-or-google-sheets-54eb07246d1e.